Totally Random – But Somewhat Bothersome Finding

We started parsing Executive and Director compensation from filings a number of years ago. We did this because when I visited our early clients I found that many were using our tools to collect this data to augment data they had available through a S&P product (which I won’t name). The decision to collect and make available this data was an easy one because it tied directly into the main reason I started directEDGAR – to reduce the time it took to collect data so our clients could focus on their research not data collection.

Being a small company with limited resources we had to make very cost focused choice about how to distribute the data and so we hit upon this idea of storing the data from a table as a JSON object in a CIK/YEAR directory because it was not hard to write Python code to deliver the data from a request file. And the infrastructure to make this happen was not too complicated.

Here is what one row of the data looks like as a JSON object:

    {
        "CIK": "100885", 
        "RDATE": "R20180328", 
        "CDATE": "C20180510", 
        "FNAME": "F59", 
        "TID": "171", 
        "NAME-LABEL": "Name and Principal Position", 
        "RID": "11", 
        "PERSON-NAME": "RHONDA S. FERGUSON", 
        "PERSON-TITLE": "EVP CHIEF LEGAL OFFICER", 
        "YEAR": "2016", 
        "SALARY": "200000", 
        "BONUS": "720000", 
        "STOCK": "400017", 
        "OPTION": "", 
        "NQDEFCOMP": "", 
        "OTHER": "59746", 
        "TOTAL": "1379763", 
        "SEC-NAME": "FERGUSON RHONDA S", 
        "PERSON-CIK": "1677193", 
        "GENDER": "F"
    }, 

This turned out to be a good choice in many ways, one of which is it allowed up to push this data to those who want the data to integrate into their offerings immediately – this works well for an API.

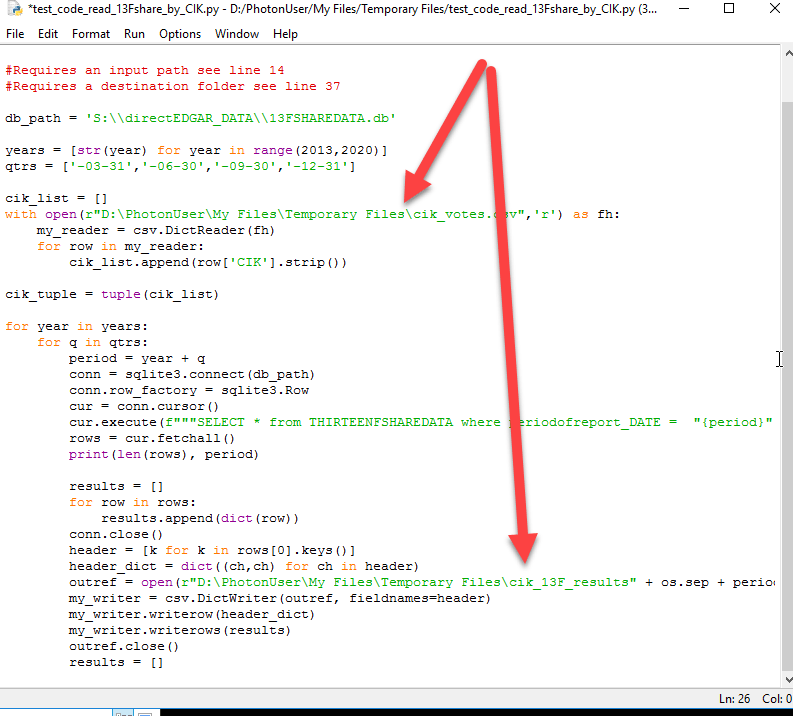
A downfall of this choice is that we have never really had an easy way to aggregate all of the data and start poking at it at scale. That JSON object you are looking at is a text string and so you have to pull the data to test values in fields. Our shift to the new platform and our decision to move all of this data into an SQL enabled database has made it easier to start looking at the data at scale. While we are still a bit away from releasing the full Executive Compensation database to the platform we are getting closer. But as I am working with it at this intermediate stage I was curious about the questions I could ask.

Preliminary View of Data

There are over 470K PERSON-YEARs in this data. It is very comprehensive going back to 2006. There was a big change in the SEC mandated disclosure for EC and DC data that took effect in early 2007 (and thus affected the disclosure of 2006 data). One key difference is that prior to the new disclosure regime most registrants did not report the value of securities that were part of the compensation package – either the number of securities (shares/options . . .) were disclosed in the table or in a footnote and it was fairly uncommon for a total compensation value to be reported.

The JSON example posted above was pulled from our archive of data filed in 2017 – that is one row for Union Pacific Railroad. Here is their EC table filed in 2004 and while they have a value for Restricted Stock Awards they do not report a value for the Options/SARs – the value you see below is a number of units. Later in the proxy they do provide one estimate of the value of those securities – but not all registrants did this. Further, notice that there is no total.

UNP 2004 Summary Compensation Table

So what is this somewhat bothersome finding. Well it blew my mind when I decided to ask the simple question – what is the gender distribution in this archive. How many FEMALE-YEARS of data have we collected?

Querying Full EC Data for Frequency of Women as Named Executive Officers

We have 45,188 person years of women (awkward phrasing)

We have 418,876 person years of males. Remember that the bulk of this data comes from 2006 to the present.

I do not mean to be a social commentator – I am not very good at it. However, we are at an inflection point in society. The world is confronted with some very complex problems and it seems to me that these problems are not going to go away unless we engage with everyone who is capable of bringing parts of the solutions to the table. The differences in the gender distribution in the data is bothersome to me because I have never believed that because I am male I should move to the front of the line. But it is hard to imagine that we could end up with a distribution like this unless others believed that only men should be able to do certain things.

If you line up all of the people in the world based on some attribute I would just struggle to imagine any meaningful attribute where the ‘best’ was dominated by men. Of course I am the guy who was knocked out by a girl in sixth grade (let me tell you I never crossed her again!). But seriously, my first boss was Mrs. Ittenbach, she owned a Dairy Queen in Odenton Maryland – she taught me how to mop floors so you could eat off of them and gave me insights on how to treat people with fairness. There has never been a time in my life where I did not know a female that was smarter than me. There were very important women in my Ph.D. program, both faculty and fellow students. There have been women leaders at every college I have worked. Most importantly, in every single class I have ever taught there are as many women who are clearly capable of great things as there are men. My neighbor (Dr. E.) and I trade Wordle and Quordle results each morning – Dr. E. takes great pleasure in crushing me. (If you haven’t figure out, Dr. E. is a woman and I am trying to say she is smarter than me.)

On the one hand, as the father of an amazing son, I certainly don’t want him denied opportunities because of his gender. But Dr. E. is the mother of two amazing daughters and I know she has the same feeling (one of her daughters is an intern for us so I know how amazing they are). But this data makes it hard to deny that there are still likely systemic issues that affect opportunities for an important part of our population.

Those of you that are math geniuses will have probably already recognized that the total F + total M does not equal total observations. We have roughly 9,000 observations without a value for GENDER in our database. This is because we only started adding GENDER to the compensation data sometime after we started collecting it.

We are going to have to first establish if there as an engineering solution available (how many of these can we code for) but then there will be plenty we can’t. The problem is that most of these are going to be from the early years, just as the SEC mandated ownership reporting through EDGAR (so we can get the PERSON-CIK and they will be people who did not remain as Named Executive Officers long enough so we won’t have them in our PERSON-CIK archive. We made a bad decision early on to not collect GENDER if we did not have a PERSON-CIK. Fortunately we have been working through the consequence of that decision for a while. It may seen easy but there are too many names where the name does not provide any GENDER clue. We will try an engineering solution first and then the balance will be parsed out to the interns to work on when they are at a waiting point for another task.

I have had two questions about access to this data in the past week. One person was able to get what they wanted from the old request system and we did run a query and provided the results for another. If you have a pressing issue and need to use this data let me know and we can work something out. We just need more testing before we are quite ready to push it out for all. I will say we will make it before we have fully addressed the missing GENDER issue – we can and will update it periodically.

I would be remiss if I did not address the other diversity issue that is problematic – racial and ethnic diversity where many groups of people are even more underrepresented in the population of leaders than women. The problem is that data is much harder to access. While the NASDAQ has developed new board diversity disclosures, these are being phased in and the disclosure requirements do not specifically specify a mapping from a person to a diversity attribute. Further they do not require disclosures about the diversity of company leadership. While some companies provide a mapping between board members and various diverse attributes, many rely instead on a schedule like the following:

Diversity Table

I used our TableSnipper to pull the available tables based on the presence of the words White, Female, and Asian. I did it again using the terms Caucasian and Gender. That seemed to cover the gamut of available tables. There are a large number of significant public companies that do not have any racial or ethnic diversity on their board. I looked at this particular company’s executive leadership and it reflected the (lack of) diversity of the board (more or less).

Director Diversity Matrix – No Diversity!

I have probably gone off the deep-end here. My initial goal was to provide an update on our EC transition. My update is a little nebulous but the important point is – if you need access before we are ready to port it out – we can probably work something out. Another important point is that is really is kind of cool to access the data so directly. I did get lost a bit there is the lack of FEMALE representation in the highest levels of public companies. And then the issue of evidence of a lack of racial/ethnic diversity on boards. It is going to be interesting to take advantage of some of these new disclosures to explore/test more granular hypotheses about how diversity adds meaningful value.

Back to Basics – Image Files in Search Results

I had an an interesting question this morning from a user – they were reviewing some search results and they came to this:

Image Heavy Document

There search returned some documents and a number of their documents would not display in the viewer. They were concerned about two issues, first how could they inspect the document and then what if they wanted to use the search results from the document.

When we push the search results to you, we are not actually pushing the document – we are pushing a cached version of the document. However, the document is almost immediately available for those cases like the one above. Just hit the Open Document button. All of the documents are stored in directories below the indexes and they load fast

After hitting the Open Document Button

This is an htm file with embedded images that contain text. The text was extracted using OCR and indexed. We do not attempt to try to create a text version of the document – OCR technology is not there yet. The search was for Organic Growth and after opening the document above I found the following:

Organic Growth

So now – how to get that text out of the document – well the ContextExtraction feature works with the text in the indexer rather than the text from the document so I set a limited context span as you can see below:

Setting Context to Extract 5 Words Around Search Phrase
Context Extraction

The OCR processor did not break paydown and Deliver – image processing is HARD.

The bottom line is that we have the document, and the search results are available – I will admit it is annoying at times to have to go through these steps.

Python Example – Using the File Path to Find Documents and Using Director Compensation Data to Find Committee Assignment Tables in Proxy Filings

I posted some new code to our PythonCode examples. One of the code examples is one approach to finding committee assignment tables. In that example I did not mention but it is important to emphasize that I first scanned over 150 or so proxy statements to identify the different ways these tables are displayed. I was able to do that by just running a quick search for (DOCTYPE (contains DEF14A)). We always have to start data collection by viewing a range of documents to learn how the filers express the concept we are trying to find. That review helped me create that list of words that are in the code. Since this is an example, I do not mean it to be exhaustive but it is a starting point.

However, in the example code I demonstrate how we can start with a list of CIKs and find the related documents. It will generally be the case that we have to tune our KEY_WORDS etc to find the right data we are trying to collect. To help with that we will probably have to inspect documents where results were not available. One of the new features we built into the latest iteration of the platform was the ability to match on the file path of document in the repository.

The example also illustrates something I personally was excited to demonstrate. We have a pretty deep archive of director compensation and we have much of our director compensation data available in an SQLITE db that you can interact with in code. Since the table that reports committee assignments usually has the name of the directors – I pulled names from the director compensation data by CIK and some specific years to use those in my attempts to identify the tables.

Pulling DC Data to get NAMES to then use to Find Tables!

Based on my visual review of the initial documents I did not see any tables that did not have either the first and last names or just the last names. So I thought a good step one is to first find tables that had names in them.

I did set up the code to save the table so we can use the SmartBrowser to review. Here is a screenshot of one of the tables that I wanted to capture:

Awesome Table as Reviewed in the SmartBrowser.

Of course there were tables that I did not want – this means I need to tinker with my collection of words. Or, I can just delete the table using the Delete Current File button. This is always a balancing act and it might take multiple iterations to find the right set of appropriate and not so appropriate words.

Wrong Table

One test I did not implement was to set minimum dimensions of the table to be snipped, nor did I require the names to be in the same column. These can be added to the code with a bit of poking around.

In the example I created, if you followed along, the summary CSV file that reports on the results includes a variable named DE_PATH. The file also includes a stop_reason value. In my example, if there is a value in stop_reason, the current iteration of the code was not able to find a table that met the criteria. This could be either because the table we are looking for does not exist or it exists in a form that is not the form we expected. The only way to establish which of those is the correct explanation is to inspect those documents.

Summary Sorted on stop_reason.

I want to inspect the documents so I delete the rows that do not have a stop_reason listed and save the file. I then start the application select the index (in my example I am using PROXY Y2022-Y2022, click the Use DB checkbox, and then select the Set DB File.

Prepping to find specific documents.

Once I have selected Use DB and hit the Set DB File the application provides an interface to select the file – remember we need the DE_PATH column in the selected CSV file.

Selecting the File with a Column DE_PATH

We still need to specify some search term. Since I want to scan these documents I intend to use the search operator XFIRSTWORD.

Results of Using DE_Path column to find specific documents

One of the things you will discover is that some group of filers insert page images into their proxy and so there is nothing we can parse with a text/html parsing strategy.

NRG’s Proxy Page Reporting on Director Committee Assignments – it is an Image!

We will add more code examples. However, that code example also demonstrates how to accomplish some other tasks. In the code example I also provided some information about resources to learn Python as well as to find the appropriate disclosure regs as they relate to the filings.

Remarks from Forms 3/4/5 and Amended Now Available

We are starting to move all of the Forms 3/4/5 data to a database format. The first (and easiest) step of this was to pull the REMARKS field from these filings and insert them into their own database.

One potential use is to identify those filings that describe transactions that were made pursuant to a 10b plan. While many of the filings include information about that reason for particular transactions in a footnote attached to the transaction some use a global indicator in the REMARKS section.

We include the CIK field as the CIK of the issuer and the rptownercik field has the CIK of the person reporting the transaction. You can merge with issuer related data or person related data using the appropriate column. The image below shows the results of a search to identify all remarks fields where there is mention of either 10B or 10-B (I noticed some users seem to reference 10-B rather than 10B).

Search to find remarks relating to the possible disclosure of transactions that could be motivated/explained by a trading plan.

We will be working to port over separate tables for derivative and then non-derivative transactions. Because the accession number will be included in all of the related tables it should be trivial to merge across the various tables. I will report that the ACCEPTANCE_TIME value was pulled from the FILING_TIMES data set by ACCESSION_NUMBER.

Python – Idle Added to Instances

I have wanted for some time to provide you the ability to use Python to interact with our repository. It is complicated and a bit frustrating as the documentation from AWS is not material I easily consume (read understand) and there are the significant restrictions on the rights associated/provided to the user profile. However, interacting with some of our clients over the last several weeks forced me to realize that we could lessen their burden a decent amount if they could interact with our archive and databases using Python in addition to our search interface. Unfortunately I am still struggling to keep the Idle shortcut on the Windows Desktop – I ultimately decided that since my clients are some of the smartest people in the world you would not mind using the Windows menu system. Below is an image where I am in a session similar to the one you would be in and am starting Python Idle.

Finding Idle on our Instances

If you by chance find the Window’s tile icon unresponsive (as I did when sharing this with my team hours after the original publication) there is another way to easily access Idle. In the top left corner of the browser frame that contains your session are a number of icons – the left-most icon is a one-dimensional set of tiles – don’t click on it – move your mouse on top of it and the applications we have made available for your use will be listed.

Accessing Applications from the Browser Menu Bar

We will slowly add some code examples – but I suspect many of you have more skills than I do. When we add a code example it will be in S:\PythonCode. You have read privileges on S: but not write privileges.

Demonstration of Finding the Python Code that is Available for Modification

If we provide Python code then we will try to comment carefully where you may need to modify the code. In this example, I was responding to a user who had a question about the raw 13F data so I ran a test to pull data for 6 years conditioned on a list of CIKs. For you to run this code you would need to have your own list of CIKs and specify your own destination. If you make the changes you would have to save the file – but you can’t save on S you would be best served by saving in Temporary Files and downloading and saving it for your own future use.

Code to Read THIRTEENFSHAREDATA table – Highlights on User Modifications.

To be clear, I have specified an input file in that code that is a CSV file with a column named CIK and I have an output folder specified that is named cik_13F_results. If you want to run this code, you will need to upload a file with a column labeled CIK and you will have to create a directory and make the changes to the code. Note – in Appstream you are the PhotonUser.

I will say that running a query using Python is faster and less resource intensive than using our Query tool because we can use a loop to break down the SELECT statement. It took about 10 minutes to generate the the six years of quarterly output files.

I did reach out to Antonis Kartapanis (TAMU) and asked him what libraries he would like available. He suggested Pandas, Numpy and BeautifulSoup4. Those are available. And since we have a long history of using LXML – that is also available. You are not able to install any preferred libraries on your instance. However, we will update these with new tools as you communicate your needs to us.

I suspect one or more of you might groan – Idle. The problem with providing access to PyCharm is that it is a licensed product and we just can’t afford to meet their very reasonable license fee requirements (there is no sarcasm in that statement – their fees are very reasonable). We are investigating allowing you to bring your license but there are only 24 hours in a day! In the meantime you can work on your code locally using PyCharm (or your preferred editor) with one or ten files of the type you will be working with and then when finished to your satisfaction move it up and run it there. It is not perfect – but better than yesterday where you would have had to download the filings you wanted to work with.

Over the coming weekend I will provide some guidance on how to use search results from our Amazing and Best in Class Search SEC Filing Search Tool with Python to accelerate your data collection.

13FSHAREDATA Available

13FSHAREDATA db viewed in Query Tool

The full first pass on providing the raw data from the 13F filings is now available. There are approximately 63 million observations out of a total of about 68 million reported in all of the 13F HR filings. I merged some of the fields from the Cover Page (these are also in the 13FHEADERDATA) to save you the complication of doing so. I am not totally sure this was the right thing to do or not.

There is no way you can expect to pull everything in one pass. We are always balancing cost/power. I had about 2,800 CIKs and I wanted for testing to pull data for report dates from the second quarter of 2016 to the third quarter of 2020 and it took about 35 minutes to pull the over 4 million results.

Pulling Data from 13FSHAREDATA Data Base

It took every bit of memory of our Appstream instance to make this particular pull and to keep it active in the DB Browser. We will try to fiddle with some optimizing choices but there are always constraints. This data has been indexed by CIK and periodofreport_DATE.

Finally we will be pushing in more CUSIP-CIK mappings as we verify new matches.

More of “We don’t know what we don’t know”!

I had an interesting week. The inside joke at our house is my inability to do any home project with only one trip to Lowe’s (my preferred home store). I think the AcademicEDGAR+ LLC inside joke needs to be – my inability to predict the amount of time some goal will take. I left one of our machines running last night to consolidate the holdings data after making the decision to use the most frequently reported price to determine the value we report. I was really excited this afternoon as I logged into the server to start doing some visual review of the data. There are just a ton of different errors in the results that we need some more time to discover what we can fix and what is not going to be addressable. Before I get into the weeds, I still intend to make the current database available. As a matter of fact I will place it there right now and use images from our software interacting with this database in my comments.

My first observation is that we did correctly parse the source files – but more than a handful of filers included data for derivative securities (mostly options) without using the proper tags to indicate that the disclosure was about a put/call or other option. In the image below I did a search for all rows that had the word put or call in the securityclass field. There should not have been any observations but I discovered 5,734. (Note, by the time this hits the wire those will be out of the final data)

Screenshot of Option Errors in 13F Summary Database

Perhaps even more surprising are the CUSIP errors. With the reorganization of Google to become a subsidiary of Alphabet the publicly traded stock of Google was retired and replaced with shares of Alphabet. I have over-simplified the legal details but as a small shareholder I noticed that the securities in my account were replaced. The CUSIP of Google Class A was 38259P508. The CUSIP of Alphabet Class A is 02079K107. And according to the SEC’s official list of 13F Securities (find the archive here) the reporting should be under the Alphabet CUSIP(s) beginning for reports filed to report on activity for Q42015.

Google’s securities as reported in the official 13F Securities List for Q4 2015
Addition of the securities of Alphabet to the Official 13F Securities List for Q4 2015

If we examine the holdings summary, there are a significant number of investors reporting holdings in GOOGLE INC and I suspect that these are actually holdings in ALPHABET INC. I am pretty confident that these CUSIPs are not properly matched and the value in that field should be the CUSIPS assigned to Alphabet.

Uncovering holdings of GOOGLE that should be reported as holdings of Alphabet.

You can see that the investors count declines across time, but still this kind of error in the source data is very surprising to me as the reporting entities have fiduciary responsibilities over more than $100 million dollars.

There are the other types of CUSIP errors – when we started looking closely at the holdings in Apple Inc – more of those came to light than I would have expected. To build the result list I used the following query statement:

(securityname  LIKE '%apple%')  AND NOT(securityname  LIKE '%maui%') and not (securityname  LIKE '%snapple%')  AND not (securityname  LIKE '%nicholas%')  AND  NOT (securityname  LIKE '%appleton%') 

Notice the use of AND NOT in the query. We perhaps should add a NOT button to the operator list. Anyway, I did not want to select on CUSIP so I had to go through some effort to get the list that is displayed. Notice that the UNIFIED SER TR . . . is still in the list.

Searching for summary results for APPLE INC to Review CUSIP errors.

Apple’s CUSIP is 037833100. As you can see above that there is a not insignificant number of data rows where the leading 0 is missing (reported CUSIP = 37833100). And then another set of results with the check figure missing (reported CUSIP = 03783310). Not visible but some other variants that are reported include 037833101 and 378331003 – I suspect that since 0 is the resulting check digit for 03783310 then 037833101 would not validate as a CUSIP (identical sequences should not have different check figures).

The bottom line is that this is going to take more work to refine than I had believed. I am actually surprised that the SEC does not force conformity to their mandated list of 13F Securities. However, while the current data is not as usable as I had hoped it would be – it is a much further along than the raw data available from the DERA website and so I have made the summary data, the raw data as well as the header file data available through the Query Database tool on our platform.

I need to be clear, the summary data consolidates all reported holdings by the reported CUSIP (by quarter). We have not yet attempted to fully analyze the CUSIP errors and so when registrants report holding in CUSIP 37833100 those will not be consolidated with holdings for 037833100. We are not ready to confidently make that claim.

We have added the CIK to both the summary data and the raw data. Again, we are only pushing out the matches for which we have a very high degree of confidence that the match is correct. Of course the CIK-CUSIP matching leads to another interesting problem to solve. When we have registrants who have changed their CIK over time how do we make sure those are available correctly? One thought I have is that for companies like Alphabet/Google, Disney and others we might should include duplicate rows for their duplicate CIKs. In other words – every summary row that contains information about Alphabet should be duplicated with the CIK and CUSIP of Google (and vice-versa). Of course then you have the GMs. The new GM is not the same as the old by any stretch and so making these mappings is complicated. It makes sense to make the time series of holdings of Alphabet include the time series of Google but it does not make sense to merge the time series of the old GM stock with the new GM stock. Clearly if we have a duplicate row there needs to be a flag.

I should also note that there is one other issue relating to amended (/A) reports that we need to address. The instructions to the 13F explicitly state “Amendments to a Form 13F report must either restate the Form 13F report in its entirety or include only holdings entries that are being reported in addition to those already reported in a current public Form 13F report for the same period.” I added the bold for emphasis. After reviewing a limited number of 13F-HR/A I concluded that when the adds new holding entries checkbox is/was selected the filing only adds new holdings to the previously filed report. This is not the case as we have recently discovered.

One example of this relates to filings made by Morgan Stanley to report on their portfolio holdings for the quarter ended 3/31/2017. Here is a link the original information table (MS Q1 2017 HR). Here is a link to the information table in the amended filing (MS Q1 2017 HR/A). The amended filing clearly indicates that it adds new holding entries. However, it only takes a cursory review to understand that the amended filing is to supersede the original because it is a restatement. This was a long-winded way to report that the amended filing was not labeled properly. However, because of the labeling we have double counted some holdings. That addresses a small fraction of the concern I raised a couple of days ago. That has to be the next issue we address. I did think about delaying the availability of this data until we can address this issue but what is the fun of that!

I’ll close this out by reporting that we have about finished making another 1,000 CUSIP-CIK matches and will update both the 13FSUMMARY data and the 13FSHAREDATA files with these new matches by next weekend.

Introduction to our Database Query Tool

This is long overdue – I hope to make you comfortable with learning how to use the Query feature we built into the platform. To access the Query interface – select the Query Databases menu item on the top menu bar.

Query Databases Selection on Menu

The platform updates dynamically now so the list of databases will reflect whatever databases are currently available, when we add a new database between your sessions with our platform the names of any new databases will be included the next time you launch a session.

The Query Databases tool with current databases listed.

When you select a particular database the Display Columns and Criteria Columns section of the interface will populate based on the definition of the table (database) that is selected. Currently, all of our databases are single table databases.

Display and Criteria populated after selecting the 13FSHARESDATA database.

Display and Criteria populated after selecting the DIRECTOR_COMP database.

If you are familiar with SQL variations think of the Display Columns selector as more or less equivalent to the SELECT statement in SQL. Display Columns determines what will be displayed and available in the output. I think by default the first eight fields are selected in all cases. To select more fields click on them. To remove a selected field from the list select it.

Removed RID from DISPLAY Columns and added TOTAL and SEC_NAME

If you want to browse the data you can just hit the Execute button without specifying any selection criteria – however, some of the databases are huge (8Kmeta, FILING_TIMES and 13FSHAREDATA from this view) and the loading time could be significant. With others though, like auditors and the compensation data – the loading time is trivial. It took me approximately 10 seconds to load all of the 567,948 records from the DIRECTOR_COMP data displayed in this image.

Selection of all records from the DIRECTOR_COMP database

You can add fields after Execute and they will load into the display (and be included in the output). Sometimes the scrollbar at the bottom of the viewer might not be immediately visible, if you want to browse the data just pull at the right bottom corner to get access to the horizontal scroll bar.

Full display of DIRECTOR_COMP after adding in the RID field and activating the horizontal scroll bar.

To save the results from the viewer use the Save Results button to activate the Save Results dialog. The default filename is DBSaveResults.csv. You can change that to whatever is appropriate.

Save Results Dialog

The application will report when the file has been saved. Since we are saving these as csv files it is important to remember that when we open them with Excel – Excel can wreak havoc on some fields by transforming them and persisting that transformation after you save the file using Excels Save As dialog. For instance a CUSIP like 1234E5671 might be saved as an exponential value. I have gotten into the habit of saving with a new name and using the original file as my input to my Python code. It is also important to remember that Excel has row and column limitations – you can create csv files with this tool that will not fully open and this will be reported by Excel.

View of initial QUERY results of DIRECTOR_COMP results.

The Criteria Columns feature allow us to specify the basis by which the application selects the rows to display (the WHERE in a SQL statement). The Comparison Operators change based on the nature of the column selected. If the column is an integer the options include Equals, Between, Greater Than or Less Than.

When a field that is defined as an integer is selected the operators allow us to specify a range, =, >, or < criteria.

Once you have specified the column, operator and values and hit the Add Criteria button the application will construct the appropriate statement and load it into the Current Criteria view. I have selected ROW_ID between 150000 and 250000.

Using range to select based on ROW_ID

To add additional criteria we need to use one of the displayed Boolean operators (AND/OR). We did not build in an AND NOT button but you can type it (just as you can directly type your criteria in the Current Criteria box without using the guided selection tool). In the image below I added AND NOT and then specified GENDER Equals F. Notice that the interface adds quotes as needed.

Additional criteria added to select rows from the DIRECTOR_COMP data.
After execution of the selection criteria, 86,676 rows selected.

Random note, we actually have some corporate entities listed in some Director and Executive compensation tables. In these cases GENDER is blank. This means that the number of rows of M + number of rows labeled as F is usually less than the total number of rows.

The Contains criteria is equivalent to the SQL LIKE operator (and that is how a query using CONTAINS is constructed). By default the application adds the % wildcard to both ends of the string you specify. I wondered if there were directors with my name or something similar so I typed URCH in the Value to Compare box and hit the Add Criteria – notice the wildcards added by default.

57 Results remain after adding the PERSON_NAME LIKE %urch% criteria.

While the application adds the wildcards by default you can edit, and say remove one to better specify your particular requirement. By removing the ending wildcard I am limiting my search to those rows with a name ending in URCH.

Modifying the LIKE clause to require names ending in URCH rather than names with URCH anywhere in the name. Notice the 14 results compared to the 57 in the previous image.

To use a list of CIKs rather than having to type many or (CIK = “CIK_1”) or (CIK = “CIK_2”) we can select a csv file that has a column named CIK (no leading or trailing spaced) with a list of CIKs (as integers not left padded with 0s). Just select the Use CIK button above, and then hit the CIK Filter button to activate a file selection dialogue:

Set CIK Filter dialogue to select a CIK file to filter results.

I had a list of 2,600 unique CIKs and I did not specify any additional criteria. Pulling the list of over 130,000 observations took about 16 seconds.

Filtering just on CIK – sample list of CIKs had 2,600 unique CIKs.

Probably a more common basis for selection would be by a list of CIKs and YEAR values. By selecting on YEAR the Comparison operators change to reflect those for integer values so I select between and specify the range 2011 to 2020. This query took quite a bit longer, the addition of the YEAR value caused the total execution time to jump to about 95 seconds.

Filtering on CIK and specifying a year range. Total execution time about 95 seconds.

I think the last tip I need to share is the use of the text IN Comparison Operator. This is useful when we need to select multiple values for the same field. To illustrate this supposed I want to identify all audit data relating to audits where the auditor location in the signature was in the states of North Dakota, Nebraska, Colorado, Wyoming, Pennsylvania, Oregon, South Carolina, Alabama, Michigan, Texas and Arizona. We could construct a query using or clauses (location_state = “NORTH DAKOTA”) or (location_state = “NEBRASKA”) . . . or (location_state = “ARIZONA”).

A less tedious strategy is to create a comma delimited list using some other application of the values you want to be selected and then paste that list into the Value to Compare box after selecting the IN Comparison Operator. In the image below I have prepared a comma delimited list of relevant state names.

State names in a comma delimited list.

If you paste this into the Value to Compare box and hit the Add Criteria button the application will quote each separate value and prepare the appropriate query expression.

After adding a list of states and allowing the application to prepare the list for a query.
Query results after filtering/selecting based on multiple location_state values.

There are times you can get the dreaded Not Responding message when you are trying to pull a large number of records. Not Responding means the application does not have any threads available to respond to user input. In the image below I wanted to get that message so I decided to retrieve all records from the FILING_TIMES database.

Not Responding while trying to retrieve all records from the FILING_TIMES database.

Frankly, I think it is cool – we have this hard drive like object in Oregon and a desktop interface that is physically separate from the hard drive like object and physically separate from my home in Omaha where I am working on this post. All of this stuff has to be pulled and matched up and it can take a while. The whole database is 4.5 gb with over 21.5 millions entries and we think it is unlikely that our users are going to need all of those values at one time. I mentioned in an earlier post that by limiting to a set of particular filings and a list of about 1,800 specific CIKs the query took about 2 minutes.

I learn so much from questions I end up getting from clients and I fully expect someone to really test the limits of this tool as others have tested the limits of other features (and thus driven improvements). I was not sure of the limits of operators in a query expression so I decided to test this out. I used Excel to create a series of CIK = expressions (alluded to above) using the list of 2,600 CIKs I worked with to create the DIRECTOR_COMP example.

Construction of a series of cik= expressions using Excel.

The application returned a dreaded Unhandled exception message that basically reports that we are limited to 1,000 operators in an expression.

Unhandled exception.

An Unhandled exception is an exception that we did not imagine could happen when we designed the code. If you get one of these messages – since we have a live connection to a database at that time it is best to hit the Quit button and restart the application as we probably need to figure out how to close and cleanly reopen the connection when these errors occur. If you don’t you might get another error because the previous error left the database in an untenable position.

I closed the application and restarted it then tried again with 995 CIKs (with 994 or statements) and it worked like a charm. Interestingly, it was much faster than using a CIK list of 995 unique CIKs.

Using 994 OR statements to select director compensation data.

I hope you find this useful. We are still working on data porting. I have another extensive post related to the 13F data coming but I am still waiting for some processing on the database to complete to I can complete the post.