Python – Idle Added to Instances

I have wanted for some time to provide you the ability to use Python to interact with our repository. It is complicated and a bit frustrating as the documentation from AWS is not material I easily consume (read understand) and there are the significant restrictions on the rights associated/provided to the user profile. However, interacting with some of our clients over the last several weeks forced me to realize that we could lessen their burden a decent amount if they could interact with our archive and databases using Python in addition to our search interface. Unfortunately I am still struggling to keep the Idle shortcut on the Windows Desktop – I ultimately decided that since my clients are some of the smartest people in the world you would not mind using the Windows menu system. Below is an image where I am in a session similar to the one you would be in and am starting Python Idle.

Finding Idle on our Instances

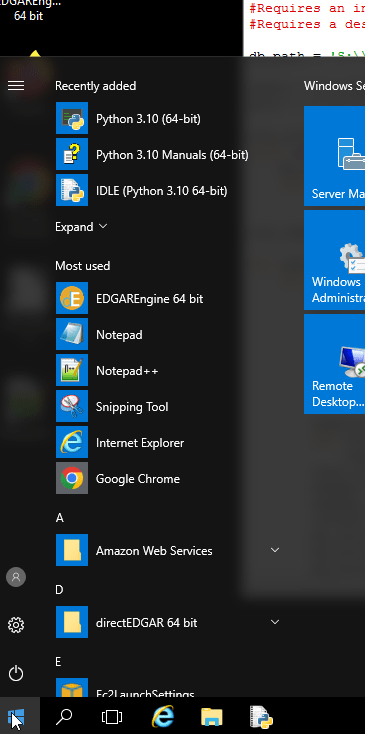
If you by chance find the Window’s tile icon unresponsive (as I did when sharing this with my team hours after the original publication) there is another way to easily access Idle. In the top left corner of the browser frame that contains your session are a number of icons – the left-most icon is a one-dimensional set of tiles – don’t click on it – move your mouse on top of it and the applications we have made available for your use will be listed.

Accessing Applications from the Browser Menu Bar

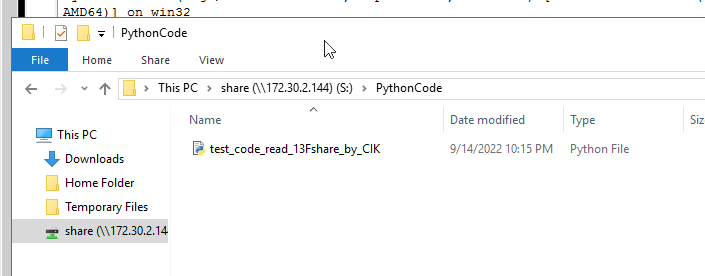
We will slowly add some code examples – but I suspect many of you have more skills than I do. When we add a code example it will be in S:\PythonCode. You have read privileges on S: but not write privileges.

Demonstration of Finding the Python Code that is Available for Modification

If we provide Python code then we will try to comment carefully where you may need to modify the code. In this example, I was responding to a user who had a question about the raw 13F data so I ran a test to pull data for 6 years conditioned on a list of CIKs. For you to run this code you would need to have your own list of CIKs and specify your own destination. If you make the changes you would have to save the file – but you can’t save on S you would be best served by saving in Temporary Files and downloading and saving it for your own future use.

Code to Read THIRTEENFSHAREDATA table – Highlights on User Modifications.

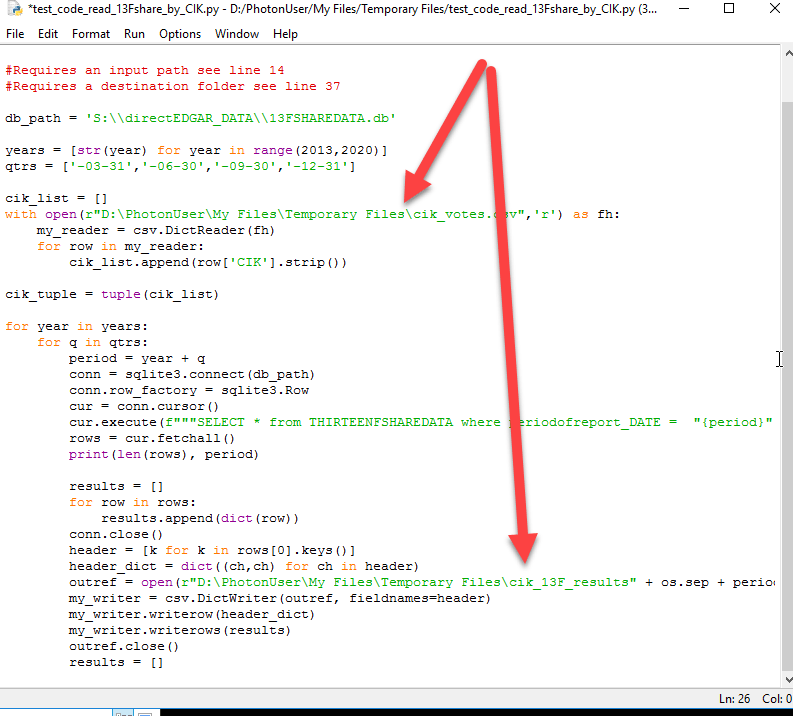
To be clear, I have specified an input file in that code that is a CSV file with a column named CIK and I have an output folder specified that is named cik_13F_results. If you want to run this code, you will need to upload a file with a column labeled CIK and you will have to create a directory and make the changes to the code. Note – in Appstream you are the PhotonUser.

I will say that running a query using Python is faster and less resource intensive than using our Query tool because we can use a loop to break down the SELECT statement. It took about 10 minutes to generate the the six years of quarterly output files.

I did reach out to Antonis Kartapanis (TAMU) and asked him what libraries he would like available. He suggested Pandas, Numpy and BeautifulSoup4. Those are available. And since we have a long history of using LXML – that is also available. You are not able to install any preferred libraries on your instance. However, we will update these with new tools as you communicate your needs to us.

I suspect one or more of you might groan – Idle. The problem with providing access to PyCharm is that it is a licensed product and we just can’t afford to meet their very reasonable license fee requirements (there is no sarcasm in that statement – their fees are very reasonable). We are investigating allowing you to bring your license but there are only 24 hours in a day! In the meantime you can work on your code locally using PyCharm (or your preferred editor) with one or ten files of the type you will be working with and then when finished to your satisfaction move it up and run it there. It is not perfect – but better than yesterday where you would have had to download the filings you wanted to work with.

Over the coming weekend I will provide some guidance on how to use search results from our Amazing and Best in Class Search SEC Filing Search Tool with Python to accelerate your data collection.

13FSHAREDATA Available

13FSHAREDATA db viewed in Query Tool

The full first pass on providing the raw data from the 13F filings is now available. There are approximately 63 million observations out of a total of about 68 million reported in all of the 13F HR filings. I merged some of the fields from the Cover Page (these are also in the 13FHEADERDATA) to save you the complication of doing so. I am not totally sure this was the right thing to do or not.

There is no way you can expect to pull everything in one pass. We are always balancing cost/power. I had about 2,800 CIKs and I wanted for testing to pull data for report dates from the second quarter of 2016 to the third quarter of 2020 and it took about 35 minutes to pull the over 4 million results.

Pulling Data from 13FSHAREDATA Data Base

It took every bit of memory of our Appstream instance to make this particular pull and to keep it active in the DB Browser. We will try to fiddle with some optimizing choices but there are always constraints. This data has been indexed by CIK and periodofreport_DATE.

Finally we will be pushing in more CUSIP-CIK mappings as we verify new matches.

More of “We don’t know what we don’t know”!

I had an interesting week. The inside joke at our house is my inability to do any home project with only one trip to Lowe’s (my preferred home store). I think the AcademicEDGAR+ LLC inside joke needs to be – my inability to predict the amount of time some goal will take. I left one of our machines running last night to consolidate the holdings data after making the decision to use the most frequently reported price to determine the value we report. I was really excited this afternoon as I logged into the server to start doing some visual review of the data. There are just a ton of different errors in the results that we need some more time to discover what we can fix and what is not going to be addressable. Before I get into the weeds, I still intend to make the current database available. As a matter of fact I will place it there right now and use images from our software interacting with this database in my comments.

My first observation is that we did correctly parse the source files – but more than a handful of filers included data for derivative securities (mostly options) without using the proper tags to indicate that the disclosure was about a put/call or other option. In the image below I did a search for all rows that had the word put or call in the securityclass field. There should not have been any observations but I discovered 5,734. (Note, by the time this hits the wire those will be out of the final data)

Screenshot of Option Errors in 13F Summary Database

Perhaps even more surprising are the CUSIP errors. With the reorganization of Google to become a subsidiary of Alphabet the publicly traded stock of Google was retired and replaced with shares of Alphabet. I have over-simplified the legal details but as a small shareholder I noticed that the securities in my account were replaced. The CUSIP of Google Class A was 38259P508. The CUSIP of Alphabet Class A is 02079K107. And according to the SEC’s official list of 13F Securities (find the archive here) the reporting should be under the Alphabet CUSIP(s) beginning for reports filed to report on activity for Q42015.

Google’s securities as reported in the official 13F Securities List for Q4 2015
Addition of the securities of Alphabet to the Official 13F Securities List for Q4 2015

If we examine the holdings summary, there are a significant number of investors reporting holdings in GOOGLE INC and I suspect that these are actually holdings in ALPHABET INC. I am pretty confident that these CUSIPs are not properly matched and the value in that field should be the CUSIPS assigned to Alphabet.

Uncovering holdings of GOOGLE that should be reported as holdings of Alphabet.

You can see that the investors count declines across time, but still this kind of error in the source data is very surprising to me as the reporting entities have fiduciary responsibilities over more than $100 million dollars.

There are the other types of CUSIP errors – when we started looking closely at the holdings in Apple Inc – more of those came to light than I would have expected. To build the result list I used the following query statement:

(securityname  LIKE '%apple%')  AND NOT(securityname  LIKE '%maui%') and not (securityname  LIKE '%snapple%')  AND not (securityname  LIKE '%nicholas%')  AND  NOT (securityname  LIKE '%appleton%') 

Notice the use of AND NOT in the query. We perhaps should add a NOT button to the operator list. Anyway, I did not want to select on CUSIP so I had to go through some effort to get the list that is displayed. Notice that the UNIFIED SER TR . . . is still in the list.

Searching for summary results for APPLE INC to Review CUSIP errors.

Apple’s CUSIP is 037833100. As you can see above that there is a not insignificant number of data rows where the leading 0 is missing (reported CUSIP = 37833100). And then another set of results with the check figure missing (reported CUSIP = 03783310). Not visible but some other variants that are reported include 037833101 and 378331003 – I suspect that since 0 is the resulting check digit for 03783310 then 037833101 would not validate as a CUSIP (identical sequences should not have different check figures).

The bottom line is that this is going to take more work to refine than I had believed. I am actually surprised that the SEC does not force conformity to their mandated list of 13F Securities. However, while the current data is not as usable as I had hoped it would be – it is a much further along than the raw data available from the DERA website and so I have made the summary data, the raw data as well as the header file data available through the Query Database tool on our platform.

I need to be clear, the summary data consolidates all reported holdings by the reported CUSIP (by quarter). We have not yet attempted to fully analyze the CUSIP errors and so when registrants report holding in CUSIP 37833100 those will not be consolidated with holdings for 037833100. We are not ready to confidently make that claim.

We have added the CIK to both the summary data and the raw data. Again, we are only pushing out the matches for which we have a very high degree of confidence that the match is correct. Of course the CIK-CUSIP matching leads to another interesting problem to solve. When we have registrants who have changed their CIK over time how do we make sure those are available correctly? One thought I have is that for companies like Alphabet/Google, Disney and others we might should include duplicate rows for their duplicate CIKs. In other words – every summary row that contains information about Alphabet should be duplicated with the CIK and CUSIP of Google (and vice-versa). Of course then you have the GMs. The new GM is not the same as the old by any stretch and so making these mappings is complicated. It makes sense to make the time series of holdings of Alphabet include the time series of Google but it does not make sense to merge the time series of the old GM stock with the new GM stock. Clearly if we have a duplicate row there needs to be a flag.

I should also note that there is one other issue relating to amended (/A) reports that we need to address. The instructions to the 13F explicitly state “Amendments to a Form 13F report must either restate the Form 13F report in its entirety or include only holdings entries that are being reported in addition to those already reported in a current public Form 13F report for the same period.” I added the bold for emphasis. After reviewing a limited number of 13F-HR/A I concluded that when the adds new holding entries checkbox is/was selected the filing only adds new holdings to the previously filed report. This is not the case as we have recently discovered.

One example of this relates to filings made by Morgan Stanley to report on their portfolio holdings for the quarter ended 3/31/2017. Here is a link the original information table (MS Q1 2017 HR). Here is a link to the information table in the amended filing (MS Q1 2017 HR/A). The amended filing clearly indicates that it adds new holding entries. However, it only takes a cursory review to understand that the amended filing is to supersede the original because it is a restatement. This was a long-winded way to report that the amended filing was not labeled properly. However, because of the labeling we have double counted some holdings. That addresses a small fraction of the concern I raised a couple of days ago. That has to be the next issue we address. I did think about delaying the availability of this data until we can address this issue but what is the fun of that!

I’ll close this out by reporting that we have about finished making another 1,000 CUSIP-CIK matches and will update both the 13FSUMMARY data and the 13FSHAREDATA files with these new matches by next weekend.

Introduction to our Database Query Tool

This is long overdue – I hope to make you comfortable with learning how to use the Query feature we built into the platform. To access the Query interface – select the Query Databases menu item on the top menu bar.

Query Databases Selection on Menu

The platform updates dynamically now so the list of databases will reflect whatever databases are currently available, when we add a new database between your sessions with our platform the names of any new databases will be included the next time you launch a session.

The Query Databases tool with current databases listed.

When you select a particular database the Display Columns and Criteria Columns section of the interface will populate based on the definition of the table (database) that is selected. Currently, all of our databases are single table databases.

Display and Criteria populated after selecting the 13FSHARESDATA database.

Display and Criteria populated after selecting the DIRECTOR_COMP database.

If you are familiar with SQL variations think of the Display Columns selector as more or less equivalent to the SELECT statement in SQL. Display Columns determines what will be displayed and available in the output. I think by default the first eight fields are selected in all cases. To select more fields click on them. To remove a selected field from the list select it.

Removed RID from DISPLAY Columns and added TOTAL and SEC_NAME

If you want to browse the data you can just hit the Execute button without specifying any selection criteria – however, some of the databases are huge (8Kmeta, FILING_TIMES and 13FSHAREDATA from this view) and the loading time could be significant. With others though, like auditors and the compensation data – the loading time is trivial. It took me approximately 10 seconds to load all of the 567,948 records from the DIRECTOR_COMP data displayed in this image.

Selection of all records from the DIRECTOR_COMP database

You can add fields after Execute and they will load into the display (and be included in the output). Sometimes the scrollbar at the bottom of the viewer might not be immediately visible, if you want to browse the data just pull at the right bottom corner to get access to the horizontal scroll bar.

Full display of DIRECTOR_COMP after adding in the RID field and activating the horizontal scroll bar.

To save the results from the viewer use the Save Results button to activate the Save Results dialog. The default filename is DBSaveResults.csv. You can change that to whatever is appropriate.

Save Results Dialog

The application will report when the file has been saved. Since we are saving these as csv files it is important to remember that when we open them with Excel – Excel can wreak havoc on some fields by transforming them and persisting that transformation after you save the file using Excels Save As dialog. For instance a CUSIP like 1234E5671 might be saved as an exponential value. I have gotten into the habit of saving with a new name and using the original file as my input to my Python code. It is also important to remember that Excel has row and column limitations – you can create csv files with this tool that will not fully open and this will be reported by Excel.

View of initial QUERY results of DIRECTOR_COMP results.

The Criteria Columns feature allow us to specify the basis by which the application selects the rows to display (the WHERE in a SQL statement). The Comparison Operators change based on the nature of the column selected. If the column is an integer the options include Equals, Between, Greater Than or Less Than.

When a field that is defined as an integer is selected the operators allow us to specify a range, =, >, or < criteria.

Once you have specified the column, operator and values and hit the Add Criteria button the application will construct the appropriate statement and load it into the Current Criteria view. I have selected ROW_ID between 150000 and 250000.

Using range to select based on ROW_ID

To add additional criteria we need to use one of the displayed Boolean operators (AND/OR). We did not build in an AND NOT button but you can type it (just as you can directly type your criteria in the Current Criteria box without using the guided selection tool). In the image below I added AND NOT and then specified GENDER Equals F. Notice that the interface adds quotes as needed.

Additional criteria added to select rows from the DIRECTOR_COMP data.
After execution of the selection criteria, 86,676 rows selected.

Random note, we actually have some corporate entities listed in some Director and Executive compensation tables. In these cases GENDER is blank. This means that the number of rows of M + number of rows labeled as F is usually less than the total number of rows.

The Contains criteria is equivalent to the SQL LIKE operator (and that is how a query using CONTAINS is constructed). By default the application adds the % wildcard to both ends of the string you specify. I wondered if there were directors with my name or something similar so I typed URCH in the Value to Compare box and hit the Add Criteria – notice the wildcards added by default.

57 Results remain after adding the PERSON_NAME LIKE %urch% criteria.

While the application adds the wildcards by default you can edit, and say remove one to better specify your particular requirement. By removing the ending wildcard I am limiting my search to those rows with a name ending in URCH.

Modifying the LIKE clause to require names ending in URCH rather than names with URCH anywhere in the name. Notice the 14 results compared to the 57 in the previous image.

To use a list of CIKs rather than having to type many or (CIK = “CIK_1”) or (CIK = “CIK_2”) we can select a csv file that has a column named CIK (no leading or trailing spaced) with a list of CIKs (as integers not left padded with 0s). Just select the Use CIK button above, and then hit the CIK Filter button to activate a file selection dialogue:

Set CIK Filter dialogue to select a CIK file to filter results.

I had a list of 2,600 unique CIKs and I did not specify any additional criteria. Pulling the list of over 130,000 observations took about 16 seconds.

Filtering just on CIK – sample list of CIKs had 2,600 unique CIKs.

Probably a more common basis for selection would be by a list of CIKs and YEAR values. By selecting on YEAR the Comparison operators change to reflect those for integer values so I select between and specify the range 2011 to 2020. This query took quite a bit longer, the addition of the YEAR value caused the total execution time to jump to about 95 seconds.

Filtering on CIK and specifying a year range. Total execution time about 95 seconds.

I think the last tip I need to share is the use of the text IN Comparison Operator. This is useful when we need to select multiple values for the same field. To illustrate this supposed I want to identify all audit data relating to audits where the auditor location in the signature was in the states of North Dakota, Nebraska, Colorado, Wyoming, Pennsylvania, Oregon, South Carolina, Alabama, Michigan, Texas and Arizona. We could construct a query using or clauses (location_state = “NORTH DAKOTA”) or (location_state = “NEBRASKA”) . . . or (location_state = “ARIZONA”).

A less tedious strategy is to create a comma delimited list using some other application of the values you want to be selected and then paste that list into the Value to Compare box after selecting the IN Comparison Operator. In the image below I have prepared a comma delimited list of relevant state names.

State names in a comma delimited list.

If you paste this into the Value to Compare box and hit the Add Criteria button the application will quote each separate value and prepare the appropriate query expression.

After adding a list of states and allowing the application to prepare the list for a query.
Query results after filtering/selecting based on multiple location_state values.

There are times you can get the dreaded Not Responding message when you are trying to pull a large number of records. Not Responding means the application does not have any threads available to respond to user input. In the image below I wanted to get that message so I decided to retrieve all records from the FILING_TIMES database.

Not Responding while trying to retrieve all records from the FILING_TIMES database.

Frankly, I think it is cool – we have this hard drive like object in Oregon and a desktop interface that is physically separate from the hard drive like object and physically separate from my home in Omaha where I am working on this post. All of this stuff has to be pulled and matched up and it can take a while. The whole database is 4.5 gb with over 21.5 millions entries and we think it is unlikely that our users are going to need all of those values at one time. I mentioned in an earlier post that by limiting to a set of particular filings and a list of about 1,800 specific CIKs the query took about 2 minutes.

I learn so much from questions I end up getting from clients and I fully expect someone to really test the limits of this tool as others have tested the limits of other features (and thus driven improvements). I was not sure of the limits of operators in a query expression so I decided to test this out. I used Excel to create a series of CIK = expressions (alluded to above) using the list of 2,600 CIKs I worked with to create the DIRECTOR_COMP example.

Construction of a series of cik= expressions using Excel.

The application returned a dreaded Unhandled exception message that basically reports that we are limited to 1,000 operators in an expression.

Unhandled exception.

An Unhandled exception is an exception that we did not imagine could happen when we designed the code. If you get one of these messages – since we have a live connection to a database at that time it is best to hit the Quit button and restart the application as we probably need to figure out how to close and cleanly reopen the connection when these errors occur. If you don’t you might get another error because the previous error left the database in an untenable position.

I closed the application and restarted it then tried again with 995 CIKs (with 994 or statements) and it worked like a charm. Interestingly, it was much faster than using a CIK list of 995 unique CIKs.

Using 994 OR statements to select director compensation data.

I hope you find this useful. We are still working on data porting. I have another extensive post related to the 13F data coming but I am still waiting for some processing on the database to complete to I can complete the post.

Decision on Determining Holdings Value – Update

When I posted yesterday about adding the 13F data I shared the challenge we were facing when we took a closer look at the summed values. Our analysis indicated that there were clear errors in the amounts reported. The question is, what to do about this?

After mucking around with the data for a couple of more hours I wondered if the best solution wasn’t to just use the most frequently observed imputed price (value * 1,000)/shares. We could calculate the value of the total holdings by taking the product of the shares and this particular price.

To justify that this is a reasonable strategy, especially for securities that are widely held let me provide some of the evidence I used to reach this conclusion.

First – here is a partial list of the imputed prices and their frequency for Abercrombie & Fitch from 13F-HR reports for the quarter ended 6/30/2013.


[(45.26, 37), (45.24, 27), (45.25, 167), (44.44, 2), (44.83, 1), (44.92, 1), (45.23, 13), (42.55, 2), (45.13, 1), (47.36, 1), (45.2, 6), (44.03, 1), (45.21, 11), (45.45, 7), (45.33, 3), (45.19, 3), (45.52, 1), (45.64, 1), (45.27, 21), (46.39, 1), (45.28, 11), (45.85, 1), (45258.41, 1), (45.22, 6), (45.46, 1), (44.94, 1), (45.31, 2), (45250.05, 1), (45.29, 10), (46.21, 1), (57.14, 1), (45.18, 4), (46.0, 1), (45.11, 3), (45250.0, 8), (45.32, 1), (47.62, 1), (45.41, 1), (45.49, 1), (66.67, 1), (45.16, 1), (50.0, 4), (45240.0, 1), (41.81, 1), (45.02, 1), (45.04, 1), (45.0, 2), (45.4, 1), (45.8, 1), (52.63, 1), (44.97, 1), (49.02, 1), (44.85, 1), (62.5, 1), (45.08, 1), (30.3, 2), (44.07, 1), (40.0, 1), (45.39, 3), (44.93, 1), (45.56, 1), (48.19, 1), (44.32, 1), (45.12, 1), (45.15, 2), (45.48, 2), (45.5, 1), (44.55, 1), (37.04, 1), (44.98, 1), (45.03, 1), (45.36, 1), (45.3, 1), (44.0, 1), (46.67, 1), (45.09, 1), (46.19, 1), (45.38, 1), (46.15, 1), (58.82, 1), (44.75, 1), (44.78, 1), (46.45, 1), (46.88, 1), (46.51, 1)]

I highlighted in red the most frequently imputed price as well as the number of times the price was reported in all of the holding consolidated from all 13F-HR for the end of the second quarter of 2013.

To establish whether or not this was a reasonable estimate of the closing price for Abercrombie & Fitch as of the end of the second quarter of 2013 I pulled up their price chart from Google. As you can see in the chart below Google reports their closing price on 6/28/2013 at $45.25 – which matches the most frequently reported price.

Abercrombie & Fitch Price Chart (pulled from Google on 8/30/2022)

June 28, 2013 was the last trading day of the quarter and therefore the closing price on that day should be the measurement price for Abercrombie & Fitch holdings.

As I am typing this I think we should include the imputed price used to determine the total value as well as the number of holdings with that imputed price and the total number of holdings (which is not the same as the total number of unique 13F-HR reports) that report one or more holdings in the security.

I repeated this analysis for 30 securities across different quarters and the most frequently reported price matched the value I located for that particular date from the price chart supplied by Google. For example, the most frequently reported value for Alphabet Class A shares (CUSIP 02079K305) for holdings as of 6/30/2018 was $1,129.19. As you can see from the screen capture of their historical prices, the closing price they report for 6/29/2018 was $56.46. Once we adjust that price for the 20-1 split that is reflected in that chart the price would be $1,129.20.

Alphabet Class A Shares Historical Pricing Highlighting the 6/29/2018 Closing Price

13F Summary & Raw Data – Available Soon

Some of you may have noticed that the SEC’s Division of Economic and Risk Analysis (DERA) consolidated the data from 13F-HR filings and made them available on a new website (DERA 13F). While that is generally a good thing I was disappointed because one of the projects we have been working on is to provide a database of the 13F data organized in a way that made it more accessible.

However, after reviewing what DERA has provided – I am glad we started this project because all they have provided is the raw data and as you will understand from reading below – the raw data is not useful without some significant work.

When we started looking at the 13F filings it looked like a simple problem. Basically we needed to consolidate by reporting quarter and security CUSIP. We have been working on another project mapping CUSIPs to CIKs (Central Index Keys) and have made significant progress. The idea is that we would push out a database with both CUSIPs and CIKs as identifiers and provide a table with the summary that included the total value and shares as well as the number of institutional investors by CUSIP/CIK and quarter. I also want to create tables of the derivative holdings (PUT/CALL) and then the debt holdings. In addition we have been strategizing on how to make the complete data set available for those of you with the skills and interest in asking more nuanced questions with this form of access.

As I noted above, this looked like a simple problem. But I am discovering, like everything we do, we don’t know what we don’t know. The code was ready to run the first pull to organize the data. We had sorted out how to identify those filings that were superseded by an amendment (This filing (JP MORGAN 1) was superseded by this one (JP MORGAN 2)). We made sure to add securities that we reported in amendments that just added to the filings list, including ones that were disclosed because of the expiration of confidential treatment.

However, while doing some sanity checks after running the consolidation code we are seeing stuff that does not make sense. I am not sure how prevalent these issues are yet because as our testing right now focuses on the first security that completes processing in the loops and since we are using Python default dictionaries as the intermediate storage container the first security tends to be Abercrombie & Fitch because of their CUSIP (002896207). The total value of holdings for Q1 2014 from summing all of the holdings listed in the relevant filings was 14,019,406. But this number is supposed to be in thousands of dollars (/1,000). When I saw that I thought that the number made no sense – they had a market cap greater than 14 billion? A review of their 10-K cover pages for 2013 – 2015 supported my questioning this value as the reported market cap was in the 2 – 4 billion dollar range.

Initially I just tried to look at individual entries in the raw value database to compare to the source file and I could not find any discrepancies – the data we collected matched what was in the filings.

Finally I just dumped all of their data by quarter into individual CSV files by quarters to see if I could get some insight. I did identify one factor that was contributing to this issue. Some filers are/were reporting actual values, not scaled values.

Here is an image of the summary dump after I computed an imputed_price variable to see if I could identify values outside the range. As you can see there are thirteen entries with an imputed price of about $38,500/share. The median price for the end of Q1 2014 was around $38.50/share. So that explains part of the discrepancy.

Small Section of Abercrombie & Fitch Holdings Reported by 13F Filers for Q1 2014.

If I re-scale those then the value of the total reported holdings by 13F filers drops to around 3 billion. This is more reasonable but it seems too large because the total shares represented in this summary is over 78 million. According to the 10-K they filed on 3/31/2014 the total number of shares reported on the cover page as of March 21, 2014 was 73,403,751.

Let me continue to get into the weeds. This is solvable but it means we have to apply a heuristic (there are over 23,000 securities – we can’t possibly check them all by hand). We have the heuristic sorted out and are about ready to move forward. One of the things I thought is that we could do this by filer. If you look in the report above, the filer value is the CIK of the reporting filer. The value 5272 is the CIK of American International Group (AIG) and so I wondered if AIG flubbed all of the data in that filing – could we put a filing flag for this. But no, that is not the case. Look at the image below – this is a snapshot of the holdings table included in AIG’s Q1 2014 filing:

AIG 13F-HR for Q1 2014 Holdings Reported 5/12/2014

The average price for ABBVIE shares is about $51.40/share. This is consistent with what I am seeing on the web for this time period (3/31/2014 closing price from one source is $50.98).

I think this inconsistency is what surprises me the most. I would have thought that this data would be trivially pulled from some internal system and there would not need to be any price adjustments. But it is hard to imagine that an internal system could be allowed to report these inconsistent values. So why the discrepancy?

We still have the issue that the total holdings seem too large relative to the reported shares. The only thought I have is that this is somehow related to short selling? I am simply baffled right now. The holdings for Abercrombie were pulled from 255 separate 13F filings, I checked 65 filings and confirmed that we captured the reported values. I also confirmed that the other reporting managers listed in 10 of the filings do not have any holding reports. I also walked through the process for kicking out holdings because of restatements. None of these explain the results.

We of course will look at ways to continue to refine this data. However, if we wait to make it perfect then it would never be available. I expect that we will post the initial database over this weekend. When we do I will send a message to your registered user account.

If you are not one of our users – be careful with the raw data.

Example Reporting Errors

A Ph.D. student at one of our client schools struck up an email exchange after reading my last post. They specifically were interested in an assertion I made that some errors in reported totals were likely the result of someone using last year’s filing as the template for this year’s filing. Their email came just as I was working on addressing the total errors for FY 2021 director compensation data.

The problem is not huge, but it is painful to address. Out of approximately 4,400 registrants that we have director compensation data for 2021 so far, there were 150 of that with sum totals. I am about 1/3 of the way through reviewing these and I have only identified two where the error seems likely to be the result of using last year’s filing table as the starting point. Here is a great example:

Director Compensation from 2022 DEF 14A Filed by TESSCO TECHNOLOGIES INC (CIK: 927355)

Notice the missing totals, each of the computed totals is off. Mr. Baitler’s total is off by $5,090 and Mr. Zifferer’s total is off by $38,921. Notice the missing totals for Bryan, Dismore, Martine-Dolecki, McCray and McLean.

Here is an image of the DC table they filed in the proxy submitted in 2021 (2021 Proxy Link):

Director Compensation from 2021 DEF 14A Filed by TESSCO TECHNOLOGIES INC (CIK: 927355)

There are no sum/total errors in the 2021 proxy and – the totals included in the 2022 proxy match the reported totals in the table above. This gives us what we think is a reasonable basis to conclude that the totals reported in the 2022 proxy are the result of a company error. Therefore we are willing to use the sum we compute for the components as the total.

However, we can’t draw any conclusion about the $20,000 difference between the reported total for Ms. Clinton in the table reporting director compensation for 3D Systems Corp (CIK 910638). The table from their 2022 proxy is displayed below. The sum of Ms. Clinton’s compensation components is $224,995. The reported total is $244,995. However, these numbers are not in the 2021 proxy so we can’t attribute this difference to the same issue that is reflected in Tessco’s data.

Director Compensation Table as Included in 3D SYSTEMS CORP’s 2022 DEF 14A

Of course the follow-up question was how prevalent are these errors? While I am not finished reviewing the 2021 data – my guess is that there will be about 100 row observations out of more than 36,000 with a total error greater than $10,000. So that gets to a sum error rate of roughly 0.3%. And the final question I had to address was – how will I know there is an error? Good question, we are not flagging data inconsistencies at the moment. We might later. The best way I can suggest is to test the difference between the total we report (which in the case above would be the total reported by the filer) and the sum of the components.

Preliminary Director Compensation Database Now Available

A Full Listing of Our Preliminary Director Compensation Database – 564,718 Rows

I have just transferred a new database to our platform. It has almost all of the director compensation data in our archives. What is excluded are those observations where we have multiple tables for one CIK year. While there are 30/40 of these cases in most years there are 550 from 2020. These cases mostly occur when the registrant anticipates not being able to file their DEF 14A on time and so they file an amended 10-K with information for Items 10-14. And then later they will file their proxy (DEF 14A). Our intention is to carefully review the duplicate cases to ensure we are distributing the data from the proxy.

There are definitely more quality checks we can run on this data and we will do so. Another reason some data is not available is because of the cases where the sum of the components of the compensation does not equal the total that is reported. We set a cut-off value for a difference of +/- $10,001. We have to review these. Sometimes the error made is clear and easy to identify, for example a transposition error or the registrant used last years table as a model while preparing their disclosure but left last year’s total in one or more rows. In other cases it is a decimal issue. While we do attempt to contact registrants when these totals differ, most do not respond and thus we will release data with a mismatched sum after we have attempted to review the data.

When you previously accessed this data through a request file, the year you specified was the document year. Now the data is available for the data year.

I have written before that detailed director compensation was not a required disclosure until 2006. We do have some limited data from 2004 and 2005. I researched these and saw that most were reported in 10-K filings that were either extremely late or were amended for some financial reporting issue. Somehow some registrants determined they needed to include the Item 9-14 data even when the tabular director compensation data was not required for that particular reporting year.

Personally I am excited about the accessibility we are able to provide with this new interface. To generate the results you see in the first image, I selected the DIRECTOR_COMP database and hit the Execute button. Doing so will generate a complete list of all rows in the database (I would be careful with respect to trying this trick with the FILING_TIMES data.

I wanted to compare the proportion of female directors in 2008 with the proportion in 2020. I ran the following query to first identify the total number of directors in 2008

(YEAR  = 2008)
All Directors for 2008 as Reported in the Director Compensation Table N = 40,413

To check for women I added AND (GENDER = “F”). As you can see this returned 3,854 results

With out getting too precise, less than 10% of directors in this group were women.

We currently have 30,070 directors compensation observations for 2020. As you can see in the image below, the number of women increased to 7,066 ~ 23% of the total population.

Female Directors from 2020 Director Compensation Tables

There is more coming – all of the tabular data we currently have will be ported to this delivery modality. It will take time but it will make it more accessible. And, as I was working on preparing this data for the platform I realized that we need to add the ability to filter by PERSON_CIK. For example, suppose you pull some executive comp and you want to check whether any of your sample are/were directors of other registrants. You should have that ability and so that feature has been added to the list.

I don’t know what I don’t know!

There is so much that we do that I know nothing about when we start. Frankly, with everything else I have been working on I knew (and still know) very little about databases. One of our clients used the new database tool last night and observed that she thought that it took too long to get her results. Of course my initial reaction was defensive. I said, come on – it took a tremendous amount of work to get that data for you – be grateful! This is someone who has been a long time user and she pushed back (she won’t let me give her credit) and said databases can work more efficiently with indexes.

She is exactly right (and maybe that is why she is a full and I am an associate). I read up on indexes, and built a CIK, FILING_DATE and FORM_TYPE index for the FILING_TIMES database. Shazam, queries were easily 10 to 100 times faster (based on my crude time keeping).

For example, it took a little over 21 minutes to identify the SUBMISSION_TIME for all 8-K filings made between 2/2/2010 and 7/16/2015 before indexing. After indexing, it took less than 30 seconds to identify the same set of 449,795 results.

Here is the query I used to identify those filings

(FORM  LIKE '%8-%')  AND (FILING_DATE  BETWEEN '2010-02-02'  AND '2015-07-16') 
Query Results

New Submission Time Database Available

We loaded a new database on the platform today (FILING_TIMES). The database has all of the available submission times from the archive of the filings made available through the SEC Old Loads Archive. Unfortunately, the archive is/was incomplete as of 7/20/22 – the 2021 Q3 directory only includes filings from 7/1 though 7/9. I have already asked the SEC if these will be made available. We did some research into other sources available through EDGAR for compiled filing archives and the sources we have identified so far do not include the submission time. Another limitation is that there are no Old Load Archive entries prior to 1996.

What we did was merged the SEC INDEX Quarterly master.idx files with the submission line from the Old Loads Archive by accession number and used those results to create the database.

The primary key in the database is the concatenation of the CIK and the ACCESSION number separated with an underscore (CIK_ACCESSION). However, you can filter on CIK and query based on filing type. This database is huge and so I would advise caution in running queries that are not limited by CIK and date ranges. It is important to remember that more than one CIK can be associated with each filing. For ownership filings, the subject company CIK will be associated with the filing as well as the reporting person’s CIK. For companies that have subsidiaries that have reporting obligations each 10-K will be filed under the CIK of the parent and each of the subsidiaries.

The database has the following keys/fields:

  1. CIK_ACCESSION
  2. CIK
  3. ACCESSION
  4. FORM (SEC FORM NAME)
  5. FILING_DATE (as reported in the master.idx file)
  6. FILER_NAME
  7. SUBMISSION_TIME

The SUBMISSION_TIME is in YYYYMMDDHHMMSS format. If you wanted to process this as a date time object in Python (assume the date is in the variable SUBMISSION_TIME) date_obj = datetime.strptime(SUBMISSION_TIME, ‘%Y%m%d%H%M%S’).

According to the log there are 21,849,043 entries in the database. When I tried to retrieve all records on my test machine using our application it took approximately 20 minutes. While profiling this it was clear that the constraint is memory, the application had to make extensive use of the Windows Page (aka Swap) File. That is not very exciting. However, when I attempted a more realistic example, I had a list of 1,885 CIKs and set the search to retrieve all filings made by this set from 6/2/2007 to 10/3/2019 (note this date span was arbitrary). With this more realistic example the process took less than two minutes.

All Filings Database

I saved that to a CSV file, but it is important to remember that Excel can only fully open files with a maximum 1,048,576 rows. This file has 2,193,942 rows.

As I am writing this I realize we might need to add some features to our Query panel to make your work easier. I did not think of including a NOT operator – and I wanted to repeat the query and exclude the ownership forms. An important point, you are not limited to the operators on the panel. If you are comfortable with SQLITE query syntax – you should be able to construct a query (limited of course by the available columns and their properties). So for example, while we did not include a NOT operator as a push button (there will be one of the next version) you can construct a query using NOT.

(FILING_DATE  BETWEEN '2007-06-02'  AND '2019-10-03')  AND NOT (FORM  IN ("3","4","5","3/A","4/A","5","A")) 
New Query Excluding Ownership Forms

By excluding ownership forms the final file had only 903,906 rows.

We have more coming!