A client asked how to collect the tabular reporting of uncertain tax positions from financial statement footnotes. That question is one example of a broader research problem. Researchers often need complete disclosure tables from the notes to the financial statements, whether the subject is uncertain tax positions, derivative notional amounts, debt maturities, pension disclosures, or some other structured footnote reporting.
The important word here is tables. We are not necessarily looking for one isolated XBRL fact as the final dataset. Instead, a distinctive fact can help us identify the table that contains the disclosure we want to collect.
This post works through that process using an uncertain-tax-position reconciliation as the example:
a disclosure of interest → a recognizable XBRL fact/tag → the directEDGAR Query Tool → identification of the relevant table → retrieval and review of the complete table → validation → optional Python scaling
Start with the disclosure we want
Our research objective is straightforward:
I want to collect the tabular reporting of uncertain tax positions from the financial statement notes in 10-K filings.
Microsoft’s uncertain-tax-position reconciliation provides a useful worked example. The object we want is the complete table: its rows, original row labels, reported values, periods, and the context needed to understand the disclosure. Extracting a single number from that table would not satisfy the research objective.

The same distinction matters in other settings. A researcher studying derivative notional amounts, for example, may also want the complete footnote table rather than one tagged value in isolation.
Find a distinctive fact in the structured representation
Once we know what disclosure we want, the next step is to find something recognizable in its structured representation. In the uncertain-tax-position reconciliation, a row such as “Decreases related to settlements” is a useful candidate. This is where our domain expertise comes into play. That language and the facts in that row are not likely to be present in many other tables. The related XBRL tag associated with that row of data can serve as a marker for tables containing this type of reconciliation.
That does not make the tag the dataset. It makes the tag a practical locator for candidate tables. The distinction matters because the same tag can appear elsewhere with a different meaning or context. We therefore use it to find tables and then inspect those tables rather than assuming that every matching fact belongs in the dataset.
To identify a candidate tag, begin by clicking a tagged fact in the XBRL filing. Then use the directEDGAR Query Tool to select the relevant 10-K database and examine how often—and where—that tag appears for the filer. Because filers choose the tags they use, the first candidate may be a company-specific extension. If so, inspect other distinctive facts in the same table and, when possible, use a suitable US-GAAP taxonomy tag as the table selector.

Start in the directEDGAR Query Tool
The normal starting point for working with the directEDGAR XBRL databases is the directEDGAR Query Tool. It lets the client choose which fields to display, specify the criteria to apply, and inspect the observations returned by the query. The practical goal is to determine whether the tag is selective enough to identify a manageable set of candidate tables.
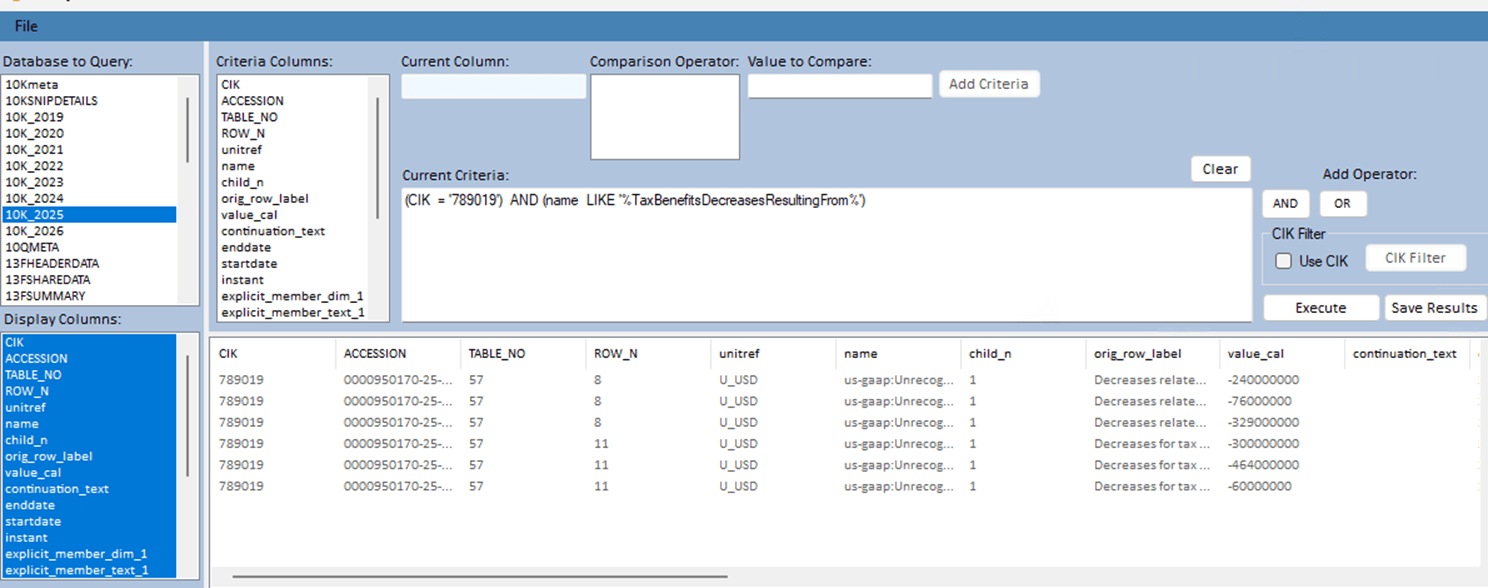
For this example, we use (CIK = '789019') AND (name LIKE '%TaxBenefitsDecreasesResultingFrom%'). The CIK limits this initial inspection to Microsoft, while the partial tag-name criterion finds candidate facts related to decreases in unrecognized tax benefits. In the 2025 10-K database, the returned observations all point to TABLE_NO 57. The result does not yet establish that this tag works across all filers, but it confirms that it leads us to the intended table in this filing.
A first inspection might display fields such as:
- CIK
- accession
- table number
- row information
- the original row label
- XBRL tag name
- reported value
- date or period information
These are part of the structure directEDGAR has preserved and organized for client use. Together they let us reconnect an observation to the underlying filing and disclosure.
Use the fact to identify the table
When the Query Tool returns an observation containing the distinctive tag, three fields provide the table identity:
CIK + ACCESSION + TABLE_NO
Those values are the bridge between one recognizable structured fact and the complete table that contains it. We can use the table identity in a follow-up Query Tool query to view all of the rows associated with that disclosure.
This is the central distinction:
The XBRL tag is useful here not because the individual fact is necessarily our data of interest, but because it gives us a way to identify the table that contains the data we want to collect.
That second query brings the researcher back to the full disclosure. Because directEDGAR preserves filing, table, row, tag, value, period, and related context, the researcher can review the table as a connected object rather than as a set of facts stripped of their surroundings. Original row labels are particularly helpful when comparing how companies describe similar concepts.
In this example, the follow-up criterion is (CIK = '789019') AND (TABLE_NO = 57). The result returns the rows of the identified table, including their row numbers, XBRL tags, original row labels, and reported values.
The displayed observations begin at ROW_N 7, but that does not mean rows 1 through 6 are missing. directEDGAR derives ROW_N from the row positions in the filing’s underlying HTML table structure. In this example, the earlier HTML rows help structure the table rather than contain the facts returned by this query. Period information is preserved separately in the instant, startdate, and enddate fields.

Validate the logic interactively
Before scaling the process, inspect multiple examples in the Query Tool. The goal is to determine whether the search logic actually identifies the intended disclosure consistently.
The practical questions include:
- Does the logic reliably identify uncertain-tax-position reconciliation tables?
- Do some filers use different standard tags for similar rows?
- Are company-specific extensions present?
- Does one branch of the search capture the relevant population, or are additional branches needed?
- Do the returned tables contain the rows and period structure required for the research design?
This interactive review is not a formality. It is where the researcher learns the variation in the data and refines the identification rule. A search based on one distinctive tag may work well for many filings while still requiring additional logic for variants or extensions.
The result should be a process whose behavior is understood and whose output has been checked against the underlying disclosures.
Not every table can be located with one distinctive tag. Identifying and reliably extracting the income statement is a more complicated example because many income-statement tags also occur in footnotes or other tables. In that setting, table identification may require a combination of tags and structural checks rather than one tag fragment. If your target presents this kind of problem, ask us. We have addressed this challenge before and can help determine whether existing directEDGAR logic provides a useful starting point.
Scale a validated directEDGAR process with Python
Only after the disclosure pattern and table-identification logic are understood does it make sense to automate the work.
Python can repeat the validated process across annual directEDGAR databases: locate observations matching the chosen tag logic, retain the associated (CIK, ACCESSION, TABLE_NO) combinations, retrieve the rows for those tables, and assemble the results for further review or analysis.
The order matters. directEDGAR helps the researcher discover, inspect, query, and validate the structured data. Python can then extend that validated directEDGAR workflow across years and larger populations. It does not replace the Query Tool work that established what the automated process should do.
Clients do not need to build this automation from scratch. A ready-to-run Python program is available in the platform’s PythonCode directory. Copy the program to My Files\Temporary Files, edit the copied version there, and run it from that folder. The program is already configured to process the annual directEDGAR 10-K databases and write a separate CSV file for each year to the Temporary Files folder.
The principal research-specific setting is tag_pattern. The supplied file is a reusable template, so replace its example value with the tag fragment developed and validated in the Query Tool. For this worked example, use:
tag_pattern = "%TaxBenefitsDecreasesResultingFrom%"distinct_query = """ SELECT DISTINCT CIK, ACCESSION, TABLE_NO FROM TENK_XBRL WHERE name LIKE ?"""data_query = """ SELECT * FROM TENK_XBRL WHERE CIK = ? AND ACCESSION = ? AND TABLE_NO = ?"""
The first query identifies the distinct (CIK, ACCESSION, TABLE_NO) combinations containing the selected tag. The second retrieves every row from each identified table. The supplied program repeats those steps across the annual databases and writes the results to CSV files.
An automated table-selection rule should not be treated as a guarantee of complete coverage. Researchers should merge the extracted results with the other data used in their study and identify companies or filings that are unexpectedly absent. A missing table may mean that the filer used different tags or organized the disclosure differently, in which case the specific filing should be reviewed. It may also mean that the company did not make the disclosure.
Full-text search can help investigate that distinction. For example, a directEDGAR search of 2025 10-K documents for filings that did not contain the phrase unrecognized tax returned 2,456 documents. Some filings may use different language, so this is not evidence that all 2,456 lacked the disclosure. It is a practical screening step that helps identify filings requiring closer review. Using directEDGAR, researchers can review missing cases more efficiently and distinguish likely non-disclosers from filings whose structure or terminology was not captured by the initial rule. Those reviews can then be used to refine and extend the data-collection strategy.

The broader method
Uncertain tax positions are only the worked example. The same method applies whenever a recognizable structured fact can help identify a larger table of interest:
- Begin with the disclosure object the research project needs.
- Find one or more distinctive facts, tags, or structural characteristics that can help identify the disclosure.
- Use the directEDGAR Query Tool to inspect matches and their filing and table context.
- Use CIK, accession, and table number to retrieve the complete table.
- Validate the logic across multiple filings and disclosure variants.
- Scale the validated directEDGAR process when the research design calls for it.
The fact is the locator. The table is the disclosure. The directEDGAR database structure is what preserves the connection between them and makes the process inspectable, testable, and scalable.